When the global oil price crashed in 2014, Nigeria was one of the hardest-hit economies due to its over-dependence on oil as a revenue source. Nigeria’s economy was also affected by China’s economic slowdown, as well as the United States’ rate hike. In order to save the economy from a total collapse, the Central Bank of Nigeria (CBN) put stringent monetary policies in place which saw investors pulling out of the country.
However, the economic condition of Nigeria has taken a new twist as the country has seen a tremendous growth in its economy. The country is out of recession, the inflation rate has dropped further and investor confidence in the country has improved. This has led to an increase in the country’s forex reserve, which in turn has helped stabilize the Naira.
Below is the Ventures Africa Weekly Economic Index, for the week ending 26th of January 2018. This economic index gives you a glimpse into the recent activities in Nigeria’s economy as well as changes that could affect the economy:
How did the Nigerian Stock Market perform?
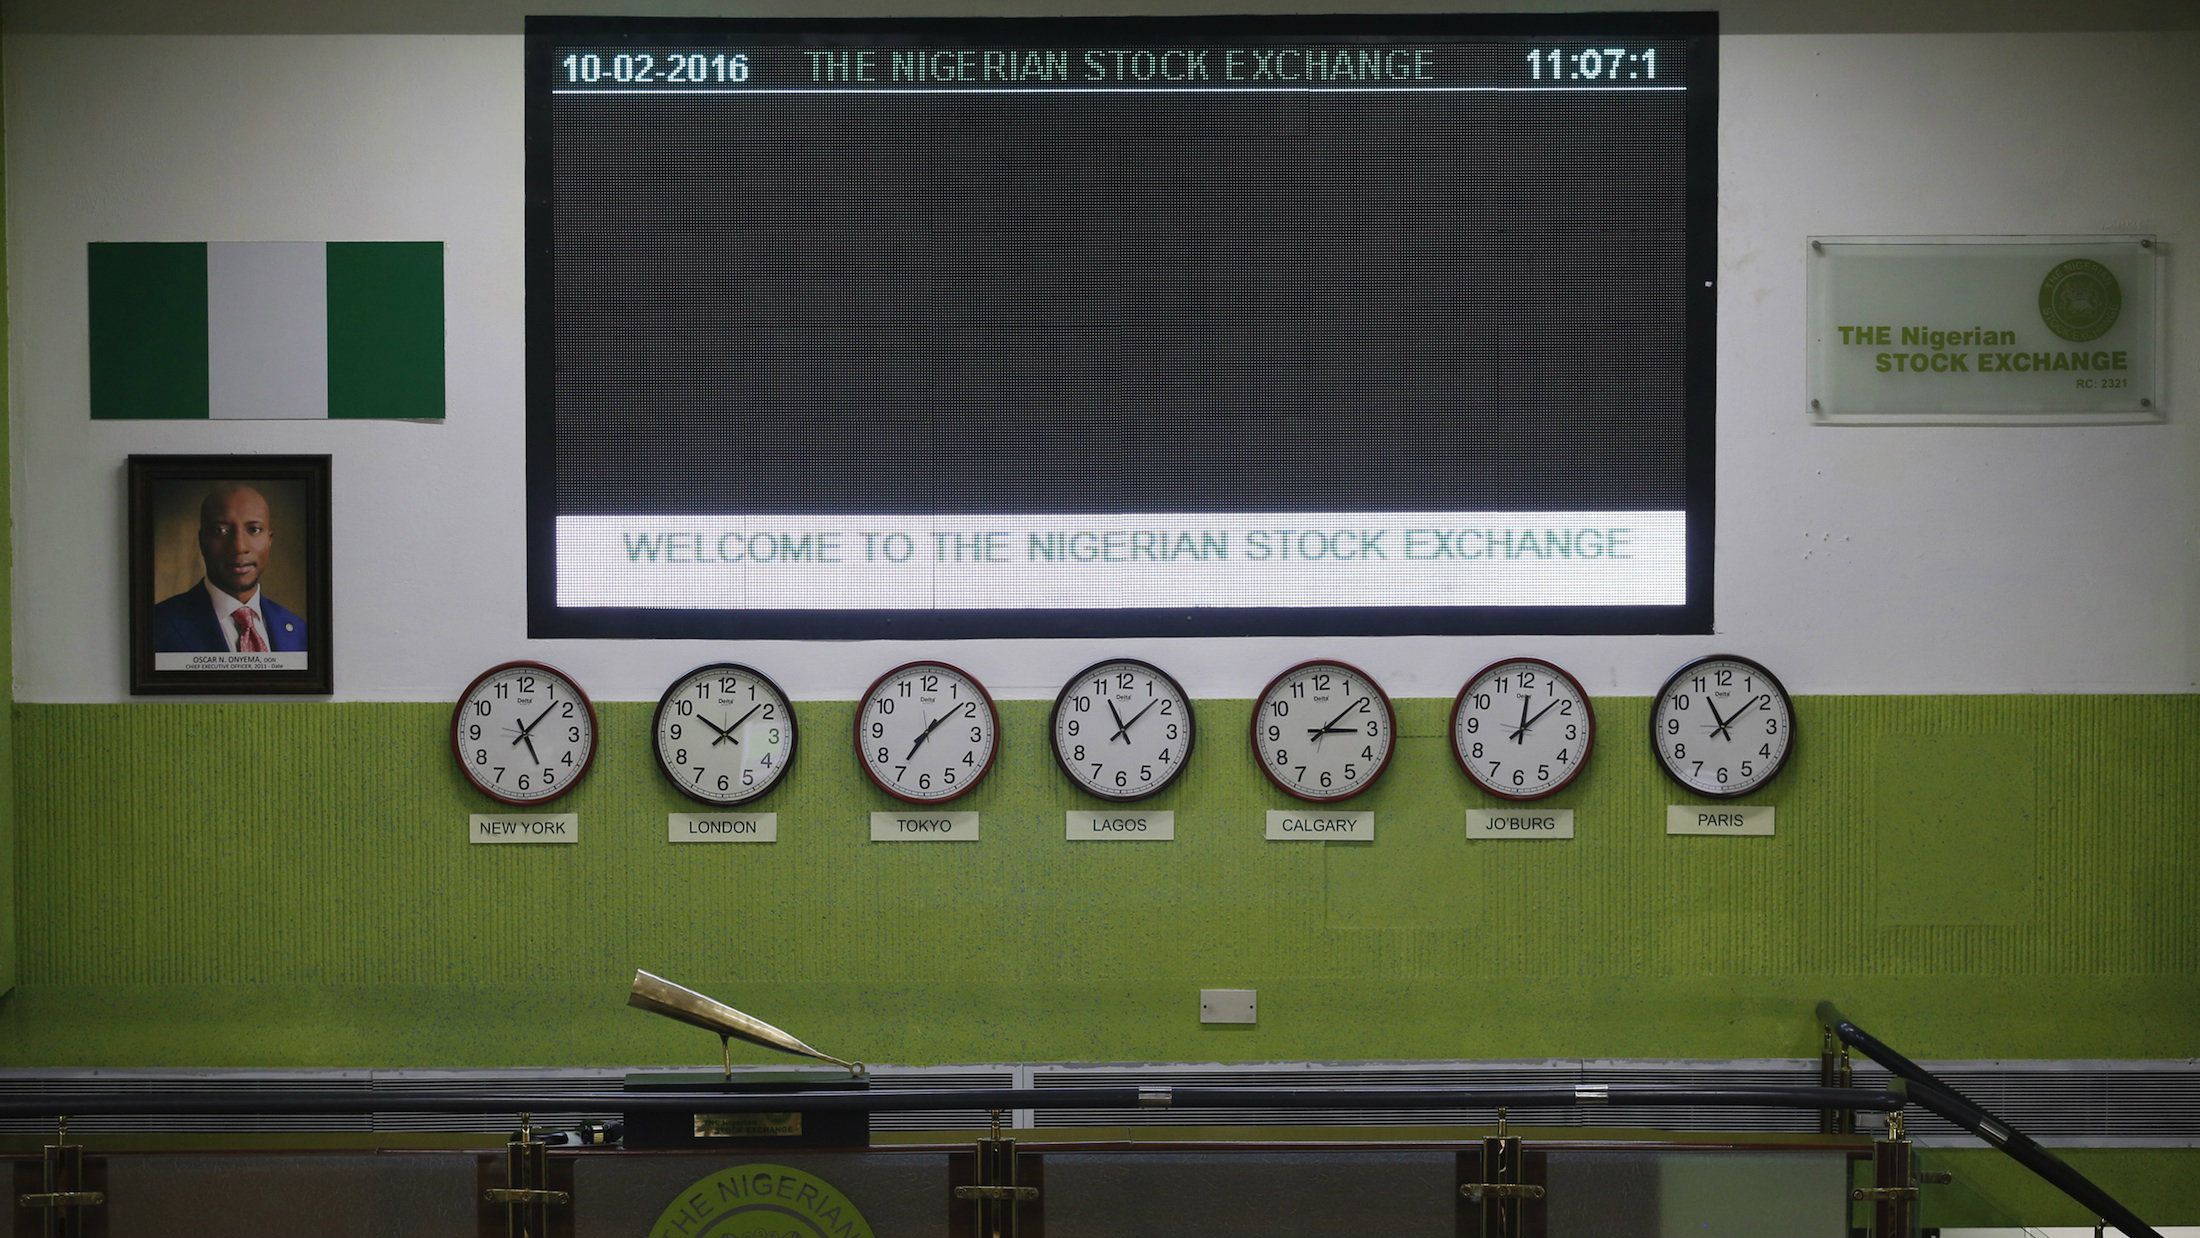
According to the recent data released by the Nigerian Stock Exchange (NSE), as of 26th January 2018, the all share index decreased by 2.93 percent from the previous week ending 19th January 2018. Market capitalization at the close of trading during the week under review was N15.692 trillion which is a 2.87 percent increase from N16.154 trillion recorded the previous week. The All Share Index for the week under review closed at 43,773.76.
Top five price Gainers and Decliners in the week under review:
Top five price gainers
- Wapic Insurance Plc.
- Dangote Sugar Refinery Plc.
- Nascon Allied Industries Plc.
- Trans-Nationwide Express Plc.
- P Z Cussons Nigeria Plc.
Top five price decliners
- Diamond Bank Plc.
- Champion Brew Plc.
- Transnational Corporation Of Nigeria Plc.
- Sterling Bank Plc.
- Honeywell Flour Mill Plc.
How high is Nigeria’s foreign reserve?

Data from the website of the Central Bank of Nigeria reveals that as of 25th of January 2018, Nigeria’s external reserve increased by $405,305,232 to $40,330,005,175 from $39,924,699,943 recorded on 18th of January 2018. The rise to $40.33 billion last week is the highest in four years. It would be recalled that in January 2014 Nigeria’s reserve dropped to $40.6 billion from $42.84 billion in December 2013.
The rise is as a result of improved foreign exchange inflow caused by an increase in crude oil price, dollar inflow from foreign portfolio investors facilitated by the Investors and Exporters (I&E) window introduced in April last year, and reduction in dollar sale through CBN’s forex intervention.
Last week, CBN Governor, Godwin Emefiele, projected that the nation may achieve $60 billion external reserves in 2019 should this trend continue.
How did the Naira fare?

During the week under review, the Naira appreciated against the dollar in the parallel market. It was sold at N364/$ on Friday ending 26th of January 2018 from an average of N365/$ recorded on the 19th of January 2018.
On Friday, the Acting Director, Corporate Communications Department, CBN, Isaac Okorafor said that “the Central Bank of Nigeria (CBN) has intervened in the Retail Secondary Market Intervention Sales (SMIS) of the Inter-bank Foreign Exchange Market to the tune of $304.4 million.”
How did the price of oil fare?

According to the OPEC weekly basket price, the price of crude oil increased from $66.48 per barrel to $67.94 per barrel between 19th of January 2018 and 26th of January 2018. During the period under review, oil prices hit their highest since December 2014.
According to reports, oil prices rallied on heavy volume on Wednesday, boosted by a record 10th straight weekly decline in US crude inventories, though reduced refining activity and rising production signalled US stocks could rise in coming weeks. Also supporting oil prices was a 0.7 percent drop in the US dollar after Treasury Secretary Steven Mnuchin’s comments that a weaker currency was positive for American trade. A weaker dollar makes greenback-denominated commodities less expensive for investors using other currencies.
What is the labour distribution in Nigeria?

Recently, the Nigerian Bureau of Statistics (NBS) released the Labour Force Statistics on Employment by Sector Report for the third quarter (Q3) 2017. According to NBS, of a labour force of 85.08 million in Q3 2017, 77.55 million are engaged in some sort of economic activity for at least an hour a week, (8.46 million – 1-19 hours; 18.02 million – 20-39 hours; 51.06 million – above 40 hours), while 7.53 million are doing absolutely nothing. (Note we classify those working less than 20 hours a week and those doing absolutely nothing as unemployed, while we classify those working 20-39 hours or doing jobs not commensurate with their qualifications and skills as underemployed).
Out of 8.46 million persons that work within 1-19 hours a week, 1.83 million or 21.67 percent work for pay/wage, 5.84million or 69.03 percent are self-employed working in agriculture (4.18million or 49.44 percent) and non-agriculture related activities (1.65 million or 19.58 percent), 83,978 or 0.99 percent are paid apprentices, and 703,240 or 8.31 percent are unpaid house workers.
Under this working hours category, Agriculture, with 59.02 percent or 5.01 million persons, dominates followed by Trade with 9.7 percent, and Professional, Scientific and Technical Services with 7.0 percent.
Out of 51.06 million persons that work above 40 hours a week and classified as employed full time, 14.10 million or 27.62 percent work for pay/wage, 33.80 million or 66.33 percent are self-employed working in agriculture (18.85 million or 36.92 percent) and non-agriculture related activities (15.01 million or 29.41 percent), 547,330 or 1.07 percent are paid apprentices, and 2.54 million or 4.98 percent are unpaid house workers.
The report further revealed that out of a total employed of 69.09 million that are classified as full time employed and underemployed which is 20 and above working hours a week, 17.88million or 25.88 percent work for pay/wage, 45.47 million or 65.82 percent are self-employed working in agriculture (25.47 million or 36.87 percent) and non-agriculture related activities (20.0 million or 28.95 percent), 779,002 or 1.13 percent are paid apprentices, and 4.95 million or 7.17 percent are unpaid house workers.